
103 Power BI and Microsoft Fabric Interview Questions and Answers (2026): The Complete Architect-Level Guide


Table of Contents
This Power BI and Microsoft Fabric Interview Masterclass is part of the FinReads Knowledge Excellence Series practical, architect-grade preparation for BI architects, analytics engineers, and Power BI developers. Follow FinReads for more interview masterclasses on Excel, SQL, Python, Tableau, and Financial Analyst roles.
The Power BI interview has changed dramatically. What used to be a question bank centered on DAX measures and pivot visuals now extends across the entire Microsoft Fabric stack One Lake, Direct Lake, Lake houses, Event houses, Dataflows Gen2, and Copilot. Hiring teams expect candidates to articulate filter context cold one minute, then explain how to wire CI/CD through Git integration the next.
This guide compiles 103 of the most technically demanding Power BI and Microsoft Fabric interview questions across eight critical domains. Every answer is shaped for the interview room concise, architect-level, and immediately repeatable. Whether you’re targeting a BI architect, analytics engineer, or senior Power BI developer role, this is your tactical preparation playbook for 2026.
Section 1: Core Architecture and Ecosystem
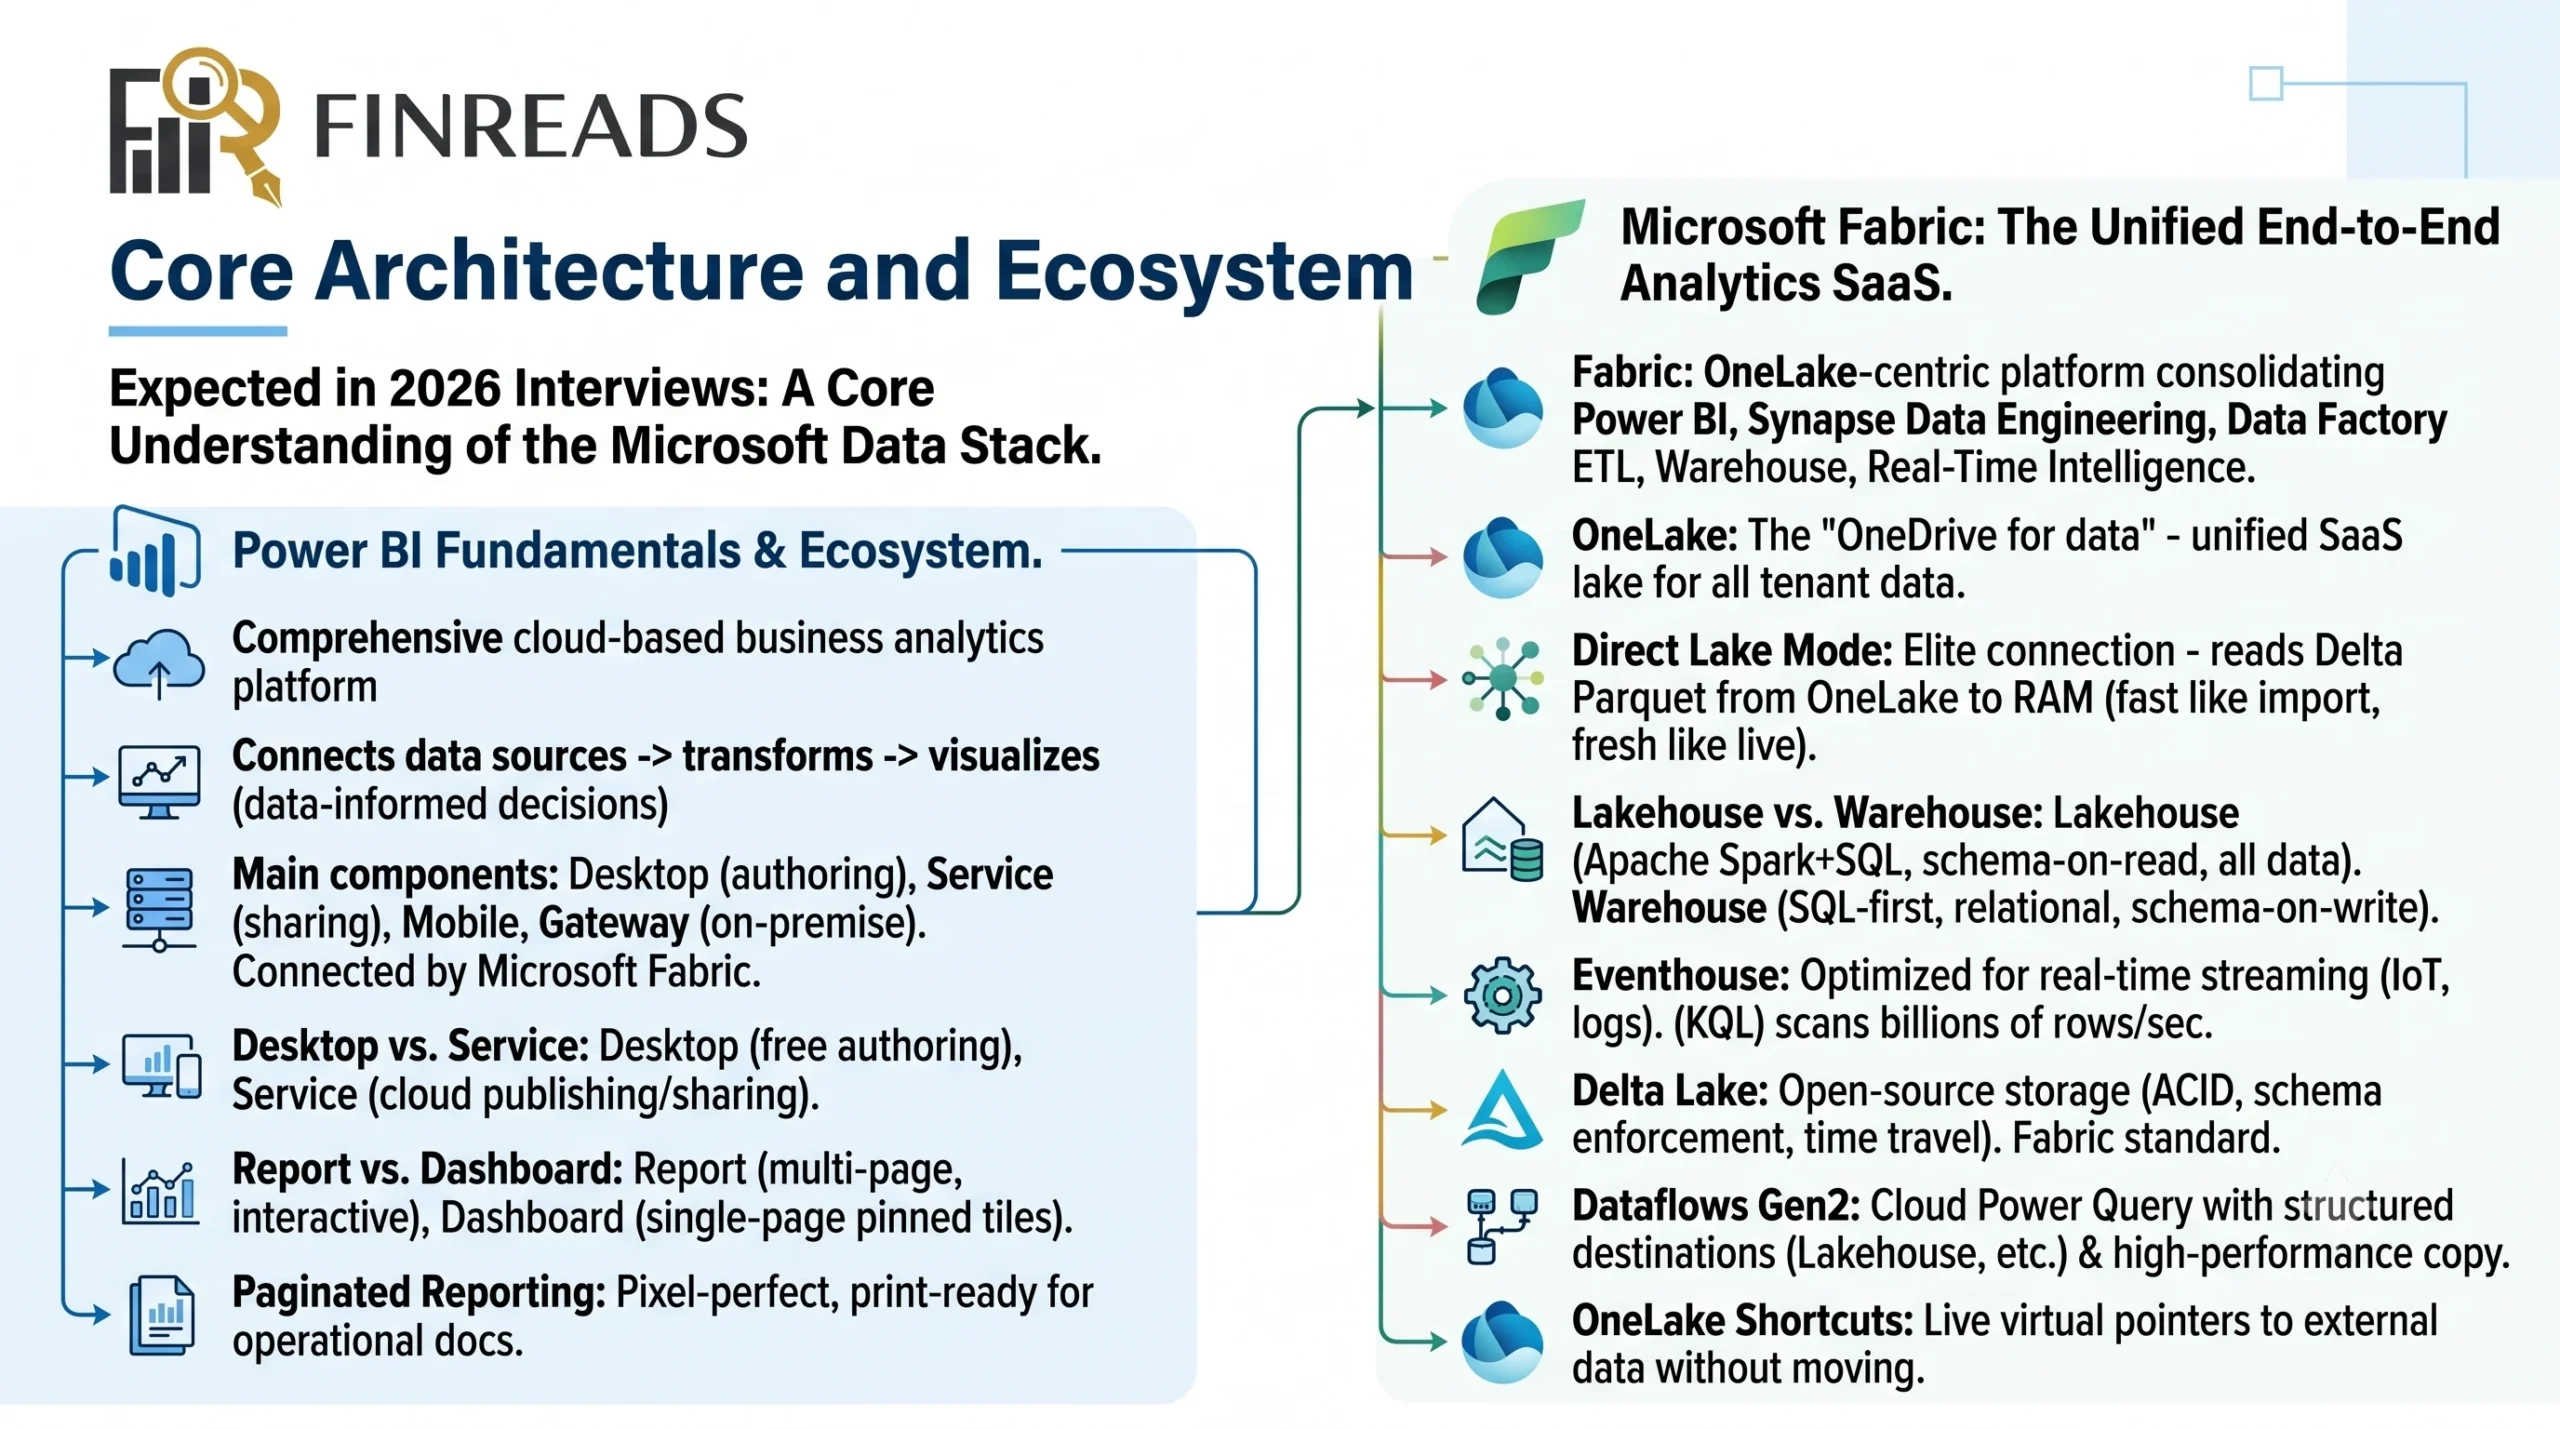
Expect this section first. It tests whether you understand Power BI’s position inside the modern Microsoft data stack not just the desktop tool.
Power BI Fundamentals
What is Power BI? A comprehensive cloud-based business analytics platform from Microsoft that connects to diverse data sources, transforms raw data into curated models, and authors interactive visualizations to drive data-informed decisions.
Main components of Power BI? Power BI Desktop (authoring), Power BI Service (cloud publishing and sharing), Power BI Mobile, Power BI Report Server, and the Gateway for on-premises connectivity. Above them sits the Microsoft Fabric platform.
Desktop vs. Service? Desktop is the free Windows authoring tool for building models and reports. Service is the cloud SaaS environment for publishing, sharing, scheduling refreshes, and collaboration.
Report vs. Dashboard? A Report is a multi-page, deeply interactive analytical document built in Desktop. A Dashboard is a single-page collection of pinned tiles from multiple reports, designed for at-a-glance monitoring.
Paginated Reporting? Pixel-perfect, print-ready reports (formerly SSRS) optimized for invoices, financial statements, and operational documents that must fit specific page layouts.
Gateways, Governance, and the Cloud Stack
Self-service BI benefits? Lets business users analyze and visualize their own data without waiting for IT — accelerating decision velocity and reducing report backlogs.
Risks of Power BI? Data sprawl, inconsistent metrics across departments, security gaps from improper sharing, and model duplication when self-service runs without governance.
Power BI vs. Tableau? Power BI uses DAX, integrates deeply with Microsoft 365 and Azure, and is priced aggressively per user. Tableau uses MDX-like calculations, handles massive datasets, and offers richer visual customization — at a steeper licensing cost.
Standard vs. Personal gateway? A standard (enterprise) gateway is a centralized, multi-user service that brokers connections from Power BI Service to on-premises sources. A personal gateway runs only for a single user under their credentials.
What happens if a data gateway goes offline? All scheduled refreshes depending on on-premises sources will fail, and any DirectQuery/Live Connection visuals to local databases will throw rendering errors.
Microsoft Fabric: The 2026 Game-Changer
This is where 2026 interviews get serious. Expect deep questioning on Fabric.
What is Microsoft Fabric? A unified, end-to-end, lake-centric SaaS analytics platform that consolidates Power BI, Synapse Data Engineering, Data Factory ETL, Data Warehousing, Real-Time Intelligence, and OneLake storage under a single capacity model.
What is OneLake? The unified, single SaaS data lake for an entire Fabric tenant — often described as the “OneDrive for data.” It stores all analytical assets in open-source Delta Parquet format, eliminating data duplication.
What is Direct Lake mode? An elite connection mode that lets the Power BI engine load Delta Parquet files directly from OneLake into RAM without importing into a .pbix or translating to slow SQL. Delivers import-level performance with real-time freshness.
Lakehouse vs. Warehouse in Fabric? A Lakehouse is built for open-source scale (Apache Spark + SQL), uses schema-on-read, and handles both structured and unstructured data. A Warehouse is a SQL-first, fully managed relational warehouse that enforces schema-on-write.
What is an Eventhouse? A specialized architecture for real-time, high-ingestion streaming data (IoT, logs, telemetry), using Kusto Query Language (KQL) to scan billions of streaming rows per second.
What is Delta Lake? An open-source storage layer that brings ACID transactions, time travel, metadata handling, and schema enforcement to Parquet files — the default storage foundation for Fabric.
Dataflows Gen2? Fabric’s modernized cloud-based Power Query engine. Unlike Gen1, it writes directly into structured destinations (Lakehouses, Warehouses, Azure SQL), uses a staging lakehouse for compute-intensive merges, and supports high-performance Fast Copy.
OneLake Shortcuts? Live virtual pointers to external files (ADLS Gen2, AWS S3, other Fabric workspaces) that instantly make data visible in OneLake without moving, copying, or paying ingress costs.
Section 2: Data Modeling and Schema Design
A well-architected model is the foundation of every fast report. Expect deep questioning here.
Schema Fundamentals
What is a Star Schema? An industry-standard dimensional model with a central Fact table (quantitative metrics and keys) surrounded by descriptive Dimension tables. This structure reduces redundancy, simplifies DAX, and maximizes calculation speed.
Star vs. Snowflake Schema? In a Star Schema, dimensions are denormalized and connect directly to the fact table via single-degree relationships. In a Snowflake Schema, dimensions are normalized into multi-level sub-tables (Product → Subcategory → Category), introducing extra joins and slowing query execution.
Advanced Modeling Patterns
Handling many-to-many relationships? The gold standard is to model a Bridge/Associative Table containing unique key combinations that resolve the M:M into two clean one-to-many relationships. This prevents ambiguous filter propagation.
Calculated tables? Tables created using DAX expressions during refresh, useful for date dimensions, scenario tables, or pre-aggregated summaries that don’t exist in source data.
Composite Models? A single semantic model that combines Import, DirectQuery, and Live Connection sources — enabling hybrid architectures where hot data lives in memory and cold data stays in the source system.
Avoiding circular dependencies in DAX? Plan calculated column logic carefully — avoid columns that reference measures that filter the same column. Use measures or restructure calculations through helper tables.
How does table expansion affect CALCULATE? Table expansion automatically extends a base table to include all related dimension columns through one-to-many relationships, which can quietly inflate filter context inside CALCULATE.
What is the Medallion Architecture? A multi-layer Lakehouse design with Bronze (raw ingest), Silver (cleansed and conformed), and Gold (business-ready aggregates) layers. It separates concerns, enables incremental refinement, and matches modern data engineering best practice.
Many-to-Many cardinality risks? Ambiguous filter propagation, unintended row duplication, and unpredictable aggregations. Use bridge tables instead of direct M:M relationships wherever possible.
Different granularity levels from multiple sources? Either model each grain in its own fact table linked through shared dimensions, or pre-aggregate the lower-grain table to match the higher-grain dimension before joining.
Why avoid bidirectional relationships? They can cause ambiguous filter paths, performance degradation, and unexpected results — especially when multiple tables filter the same dimension. Use unidirectional relationships with explicit CROSSFILTER() overrides when needed.
Section 3: Data Analysis Expressions (DAX)
DAX is the heart of the Power BI interview. Expect the largest share of questions here.
DAX Fundamentals
What is DAX? A specialized, functional formula language used in Power BI, Power Pivot, and SQL Server Analysis Services to define custom calculations, business metrics, and dynamic tables.
Calculated Column vs. Measure? Calculated Columns are computed row-by-row during refresh, consume RAM and disk space, and are static. Measures are computed dynamically at query time, adapt to filter context, consume zero persistent storage, and are ideal for aggregations.
SUM vs. SUMX? SUM is a simple aggregator that scans a single column. SUMX is an iterator — processes a table row-by-row, evaluates an expression in each row’s context, then sums the results.
Row Context vs. Filter Context? Row Context is the engine’s awareness of the current single row (active in calculated columns and iterators). Filter Context is the set of active filters (slicers, visual layouts, headers) defining the subset of data a measure calculates over. Understanding both contexts cold is non-negotiable.
Quick Measures? Pre-packaged DAX calculations (year-over-year, rolling averages, running totals) generated through Power BI’s UI without writing raw DAX.
Filter Manipulation Functions
ALL() vs. ALLEXCEPT()? ALL() clears all active filters from a specified table or column. ALLEXCEPT() clears all filters from a table except the columns explicitly defined.
RELATED vs. RELATEDTABLE? RELATED() pulls a single scalar value from the “one” side of a relationship to the active row on the “many” side. RELATEDTABLE() returns an entire sub-table of matching rows from the “many” side to the “one” side.
Calculation Groups? A model feature that reduces redundant measures by defining a calculation pattern once (e.g., YTD, MoM, QoQ) as a calculation item, then dynamically applying it to any base measure.
Time Intelligence and Common Patterns
Fix a DAX measure giving wrong results in a matrix? Caused by incorrect filter context or relationship cross-filtering. Debug by checking relationships, verifying coordinates with VALUES() or SELECTEDVALUE(), and wrapping in CALCULATE() to alter filter context.
YTD for a custom fiscal year? Use a dedicated continuous Calendar table and apply TOTALYTD with the optional fiscal year-end parameter:
TOTALYTD(SUM(Sales[Amount]), ‘Dates'[Date], “03/31”)
Fix an AVERAGE measure showing incorrect subtotals? A naïve AVERAGE averages totals at subtotal level. Replace with:
DIVIDE(SUM(Sales[Amount]), DISTINCTCOUNT(Sales[ID]))
Current year vs. last year sales? Shift filter context back one year with time intelligence:
Sales_LY = CALCULATE([Total_Sales], SAMEPERIODLASTYEAR(‘Dates'[Date]))
What-If parameters? Create a disconnected parameter table via the “New Parameter” wizard, bind it to a slicer, and capture the user’s selection with SELECTEDVALUE() to simulate scenarios like price hikes.
CALCULATE and Context Transition
What is CALCULATE()? The single most powerful function in DAX. It evaluates an expression in a modified filter context — adding, overwriting, or removing filters defined as arguments.
How do you use SUMX()? SUMX(Table, Expression) loops row-by-row, establishes row context in each row, evaluates the expression, and sums the results.
Best practices for optimizing large DAX models? Remove unused high-cardinality columns, prefer measures over calculated columns, cache duplicate computations using Variables (VAR), avoid nested iterators, and use pre-calculated Aggregations on huge tables.
What is Context Transition? The transformation of active Row Context into Filter Context. Triggered explicitly by CALCULATE() or implicitly when a measure is referenced inside an iterator like SUMX.
Measure referenced inside an iterator? Because measure references invoke an implicit CALCULATE wrapper, referencing a measure inside an iterator triggers Context Transition — converting the current iterated row’s attributes into filters before evaluating.
Error Handling and Set Operations
Handle division by zero in DAX? Use DIVIDE(Numerator, Denominator, AlternateResult). It’s natively optimized to handle nulls and zeros safely, returning BLANK or a specified default.
VAR and RETURN syntax? Variables let you evaluate and store intermediate results once, then reuse them in the RETURN block — dramatically improving readability and processing speed.
KEEPFILTERS role? By default CALCULATE overwrites existing filters. Wrapping a filter in KEEPFILTERS() forces the new filter to intersect with the existing context instead of replacing it.
UNION, INTERSECT, EXCEPT?
- UNION: Appends rows from multiple tables with identical column structures (retains duplicates)
- INTERSECT: Returns rows that exist in both tables (removes duplicates)
- EXCEPT: Returns rows that exist in the first table but not the second
Why avoid filtering entire tables in CALCULATE? It forces the engine to scan the entire wide table row-by-row in the single-threaded Formula Engine. Filter individual columns instead to leverage the multi-threaded Storage Engine’s column indexes.
Purpose of COALESCE? Returns the first non-BLANK expression from a list — useful for replacing nulls with clean defaults like zero.
Advanced DAX Patterns
Resolve “Single value for column cannot be determined” error? You’re referencing a raw column where the engine expects a scalar. Wrap it in an aggregator (MAX, SUM) or place it inside an iterator.
Why is EARLIER a performance anti-pattern? EARLIER navigates nested row contexts but is opaque and slow. Modern DAX uses Variables (VAR) instead — explicit, faster, and more readable.
Dynamic parameters for switching measures (YoY, MoM, QoQ)? Create a disconnected table with measure labels, capture the selected label with SELECTEDVALUE(), and use SWITCH() to return the corresponding measure.
Rolling 7-day average conversion rate? Use CALCULATE with DATESINPERIOD to define a 7-day sliding window:
CALCULATE(
DIVIDE([Conversions], [Visits]),
DATESINPERIOD(‘Dates'[Date], MAX(‘Dates'[Date]), -7, DAY)
)
FORMAT function? Converts a value into a text string using a specified format code — useful for currency, percentages, and custom date formats.
COUNT vs. DISTINCTCOUNT? COUNT counts non-blank numeric values. DISTINCTCOUNT counts unique non-blank values.
Improve DAX readability and performance simultaneously? Use Variables (VAR) for both — they document the calculation step-by-step and cache intermediate results.
Section 4: Power Query and ETL (M Language)
Modeling fails when ETL is wrong. Expect questions on query folding, M language, and transformation patterns.
Power Query Essentials
What is Query Folding? Power Query’s ability to push transformation steps back to the source (translating into native SQL) instead of processing locally. Verify by right-clicking a step → View Native Query. If the option is greyed out, folding has broken — and performance with it.
What are Dataflows? Cloud-based reusable ETL pipelines that extract, transform, and store cleaned data centrally — preventing the “every analyst rebuilds the same transformation” problem.
Handling NULL values in Power Query? Use Replace Values to substitute defaults (0, “Unknown”), or Remove Rows → Remove Blank Rows. For column-level imputation, use conditional columns.
What is the M language? A powerful, case-sensitive, functional mashup and query language behind Power Query, used to extract, filter, shape, transform, and load data into the model.
Merging, Joining, and Transformations
Merge queries on multiple columns? In the Merge dialog, select the primary table, hold Ctrl and click columns in a specific sequence, then repeat the exact order in the secondary table to align join keys.
Power Query Merge join types? Six joins are supported:
- Left Outer: All rows from first table + matching rows from second
- Right Outer: All rows from second + matching rows from first
- Full Outer: All rows from both, nulls where unmatched
- Inner: Only matching keys in both
- Left Anti: First-table rows with no match in second
- Right Anti: Second-table rows with no match in first
Visual Query Editor in Fabric? A low-code GUI in Microsoft Fabric for visually querying, grouping, and shaping data in Lakehouses and Warehouses — no manual SQL or KQL required.
When are filters applied in the Visual Query Editor? Before aggregations or groupings — ensuring summarized results are accurate and the engine scans a smaller, pre-filtered dataset.
Troubleshooting and Data Quality
Dashboard numbers don’t match the source system — how do you troubleshoot? Follow this systematic approach:
- Identify the exact metric and time period showing variance
- Check data refresh history and gateway status
- Inspect visual-, page-, and report-level filters
- Review DAX logic (date relationships, blank handling, filter overrides)
- Run identical queries on the raw source and match row-by-row
Data source schema changes unexpectedly? Identify the broken step in Power Query, update transformations to accommodate. Best practice: request DBAs to provide stabilized Database Views as an abstraction layer rather than querying physical tables directly.
Purpose of Data Profiling in Power Query? Provides visual statistics — Column Quality, Column Distribution, and Column Profile — to immediately spot errors, empty cells, outliers, and structural anomalies.
Section 5: Data Visualization and UX
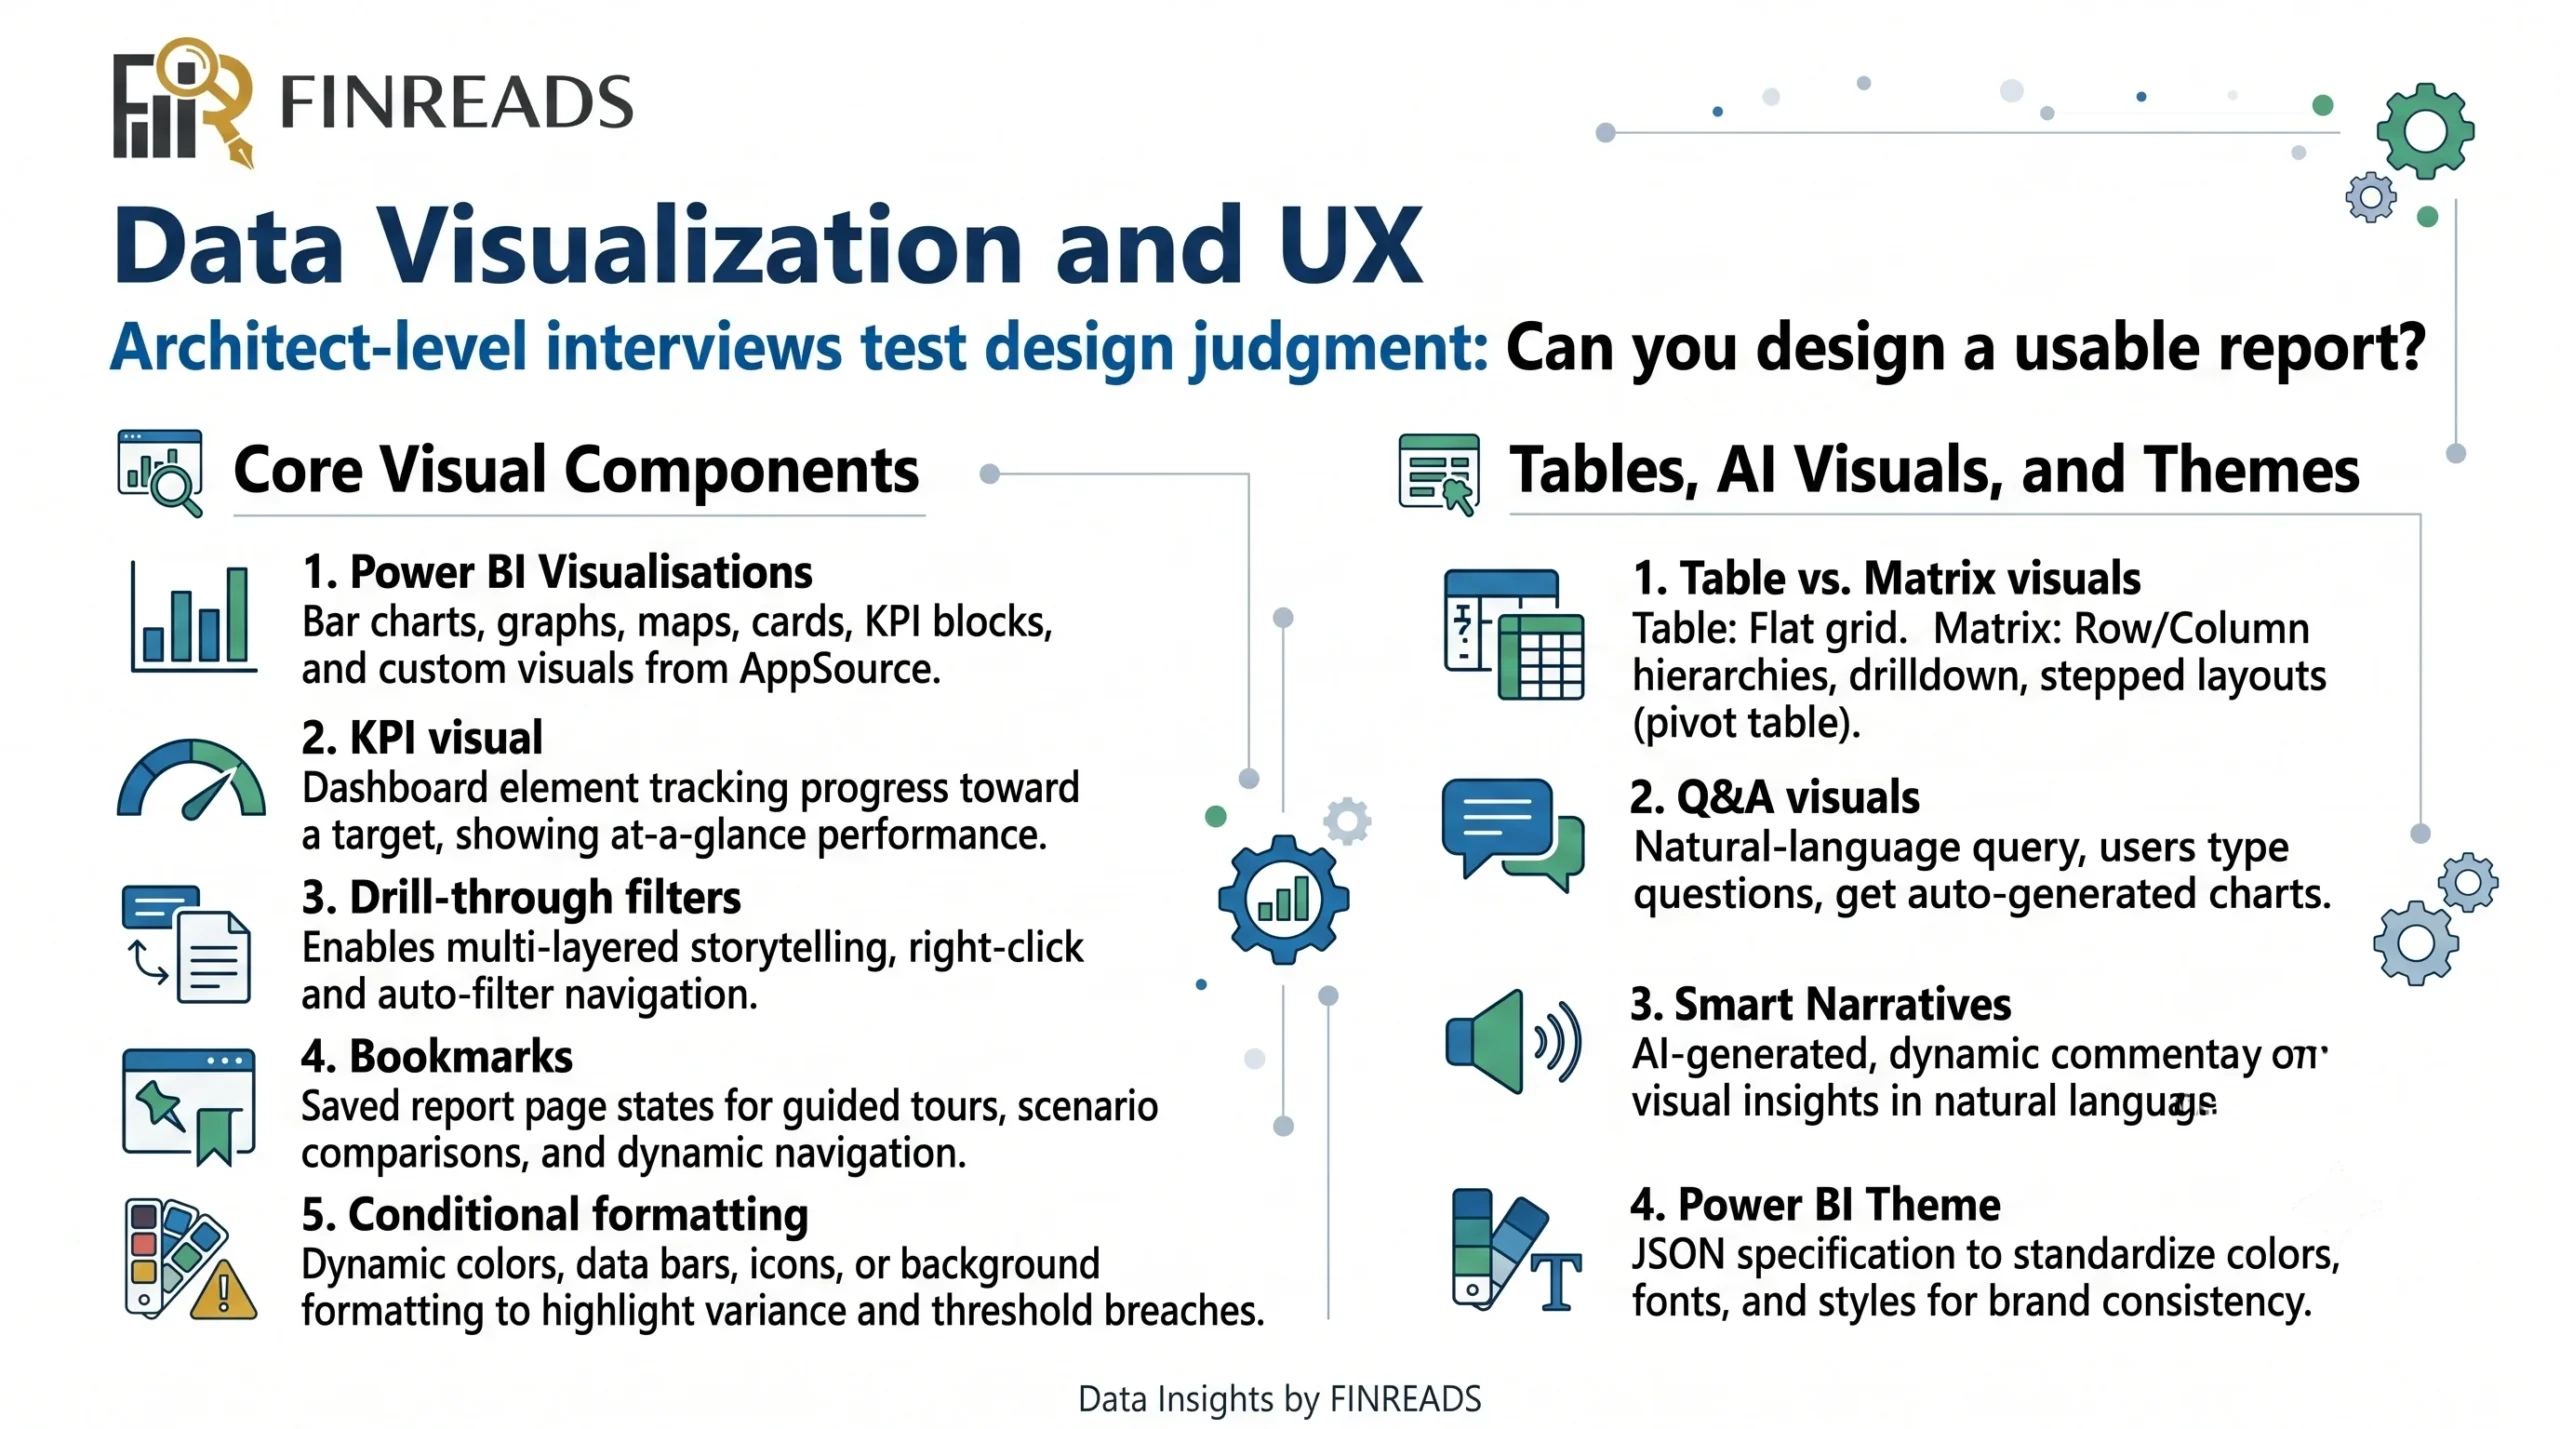
Architect-level interviews increasingly test design judgement — not just whether you can build a chart, but whether you can design a usable report.
Core Visual Components
Power BI Visualisations? Graphical components representing data trends — bar charts, line graphs, maps, cards, KPI blocks, and custom visuals from the AppSource marketplace.
KPI visual? A specialized dashboard element that tracks progress toward a target, showing on-track or off-track performance at a glance.
Drill-through filters? Enables multi-layered storytelling — users right-click a data point and navigate to a separate, detailed report page automatically pre-filtered by that selection.
Bookmarks? Saved states of a report page (filters, slicers, visibility) that can be applied on demand. Useful for guided tours, scenario comparisons, and dynamic navigation.
Conditional formatting? Applies dynamic colors, data bars, icons, or background formatting based on cell values, rules, or DAX expressions — perfect for highlighting variance flags and threshold breaches.
Tables, AI Visuals, and Themes
Table vs. Matrix visuals? A Table is a simple flat row-by-row grid. A Matrix supports row and column hierarchies, drilldown, and stepped layouts — essentially a pivot table.
Q&A visuals? Natural-language query visuals letting users type questions like “sales by region last year” and receive an auto-generated chart.
Smart Narratives? Auto-generated, AI-written commentary that describes a visual’s key insights in natural language and updates dynamically as filters change.
Power BI Theme? A JSON-based design specification that standardizes colors, fonts, and styles across an entire report — essential for brand consistency at enterprise scale.
Section 6: Performance Optimization
This is where senior interviews dig in. Expect both conceptual and diagnostic questions.
Connectivity Modes and Aggregations
Data connectivity modes? Import (loads data into VertiPaq, fastest), DirectQuery (queries source live, freshest), Live Connection (connects to external SSAS/Power BI dataset), and Direct Lake (Fabric-only, loads Delta Parquet directly into RAM).
Optimising performance in large datasets? Reduce cardinality, prefer measures over calculated columns, use aggregations, apply incremental refresh, and design with a star schema. Use DAX Studio and Performance Analyzer to profile bottlenecks.
Aggregations in Power BI? Pre-calculated, summarized cache tables stored in RAM. When users query massive datasets, Power BI automatically hits these fast caches first, avoiding slow scans of detailed transaction logs.
Incremental Refresh? Configures Power BI to load and refresh only new or recently updated partitions rather than reloading the entire history each time — dramatically reducing gateway load and refresh duration.
Debugging and the Engine Architecture
Optimize a report for big data without changing models? Turn off the global Auto Date/Time setting, minimize visuals per page, use restrictive slicers, limit cross-filtering, and ensure queries filter at source before loading.
Debug slow DAX queries? Use Performance Analyzer in Power BI Desktop to record rendering times. Extract the slow visual’s query and open it in DAX Studio to examine Server Timings — checking whether bottlenecks lie in the Formula Engine or Storage Engine.
Formula Engine vs. Storage Engine? The Formula Engine (FE) is a single-threaded processor executing complex logical DAX. The Storage Engine (SE) is a multi-threaded columnar processor (VertiPaq) that scans, filters, and aggregates raw data at extreme speed. Push work to the Storage Engine wherever possible.
Section 7: Security, Governance, and Deployment
Enterprise interviews go deep here. Know RLS, deployment pipelines, and the modern CI/CD flow cold.
Row-Level Security and Beyond
Row-Level Security (RLS)? An access control mechanism that filters data at the semantic model row level based on user role. A user assigned the Europe role sees only Europe sales rows; others remain hidden from queries.
Workspace governance? Define strict workspace roles (Admin, Member, Contributor, Viewer), enforce Sensitivity Labels, segregate staging dataflows from reporting datasets, and use centralized deployment pipelines.
Deployment Pipelines? An Application Lifecycle Management (ALM) feature for systematically promoting semantic models and reports across isolated environments: Development → Test → Production.
XMLA Endpoint? A read/write gateway exposing Power BI Premium datasets to external tools (Tabular Editor, ALM Toolkit, SSMS) for advanced metadata editing, scripted updates, and CI/CD automation.
Dynamic RLS? Establish a security mapping table linking user emails to territories. Write a DAX security rule:
[Email] = USERPRINCIPALNAME()
Securing data beyond RLS? Configure Object-Level Security (OLS) to restrict columns or tables containing PII, apply Microsoft Purview Information Protection tags, and enforce Entra ID authentication.
Sharing, Filtering, and Real-Time Alerts
Share a dashboard externally without a Pro license? Place workspaces on a Premium Capacity (F64 or higher), allowing free-account users to consume shared reports securely.
Filtering vs. RLS? Filtering shapes query limits for clarity and performance. RLS explicitly enforces data access security at the engine level — preventing unauthorized users from viewing confidential records.
Data Activator in Fabric? A no-code real-time monitoring and alerting engine that continuously tracks streaming data or Power BI thresholds and triggers automated actions (emails, Teams alerts) when conditions are met.
Implement CI/CD for Power BI in Fabric? Enable native Git integration in your Fabric workspace to serialize datasets and reports into JSON, then commit to Azure DevOps or GitHub for code reviews and automated deployments.
Tabular Editor? An external modeling tool for managing Power BI semantic models — bulk metadata changes, advanced scripts, calculation groups, and Best Practice Analyzer rules.
Section 8: AI and Next-Generation Analytics
The newest layer in 2026 interviews. Expect questions on Copilot capabilities and AI-powered visuals.
What is Copilot in Power BI? A generative AI assistant that helps developers write DAX, build new report pages, draft natural-language narratives, and lets users explore data through conversational queries.
Prerequisites for Copilot?
- Capacity: Workspace on a paid Fabric capacity of F64 or above (or Premium P1 equivalent)
- Tenant admin: AI/Copilot feature switches enabled in the Fabric admin portal
- Geography: Tenant region settings allowing cross-region data transfers if servers reside outside designated areas
- Model quality: Clean semantic model metadata — proper relationships, well-named measures, clear conventions
Key Influencers and Decomposition Tree? Two built-in AI visuals:
- Key Influencers uses ML to identify which factors most significantly impact a chosen metric (e.g., what drives churn), ranking contributors by influence strength
- Decomposition Tree is an interactive visual that breaks down a measure across multiple dimensions in any order, automatically suggesting the next “high-value” or “low-value” dimension for root-cause exploration
How to Prepare for Your Power BI Interview

You now have the architectural map. Here’s how to convert it into interview performance:
- Master DAX context cold. Row Context vs. Filter Context, and Context Transition, are the single most-tested concepts. If you can’t explain how a measure inside SUMX triggers context transition, prioritize this above everything else
- Know the Fabric stack fluently. OneLake, Direct Lake, Lakehouse vs. Warehouse, Delta Lake, Dataflows Gen2 — these are 2026 differentiators. Candidates who confuse Direct Lake with DirectQuery get filtered out fast
- Build a portfolio piece. Have at least one Power BI dashboard you can walk through technically — the data model, the DAX choices, the visual decisions, and the trade-offs you made
- Learn the diagnostic tools. Performance Analyzer, DAX Studio, and Tabular Editor aren’t optional for senior roles — be ready to explain how you’d profile a slow query
- Practice the 30-second answer. Every answer in this guide is calibrated for the interview room — concise, precise, and architect-level. Practice each one out loud
- Match depth to role. A Power BI developer won’t be drilled on Eventhouse architecture. A BI architect will. Tailor preparation to the specific role description
Final Thoughts
The modern Power BI interview has expanded into a full-stack data platform assessment. Where candidates once needed DAX fluency and visual design sense, they now need to articulate Microsoft Fabric architecture, defend modeling decisions at the Lakehouse level, and explain how Copilot fits into governed enterprise reporting.
This guide has covered all eight critical domains — architecture and Fabric, data modeling, DAX, Power Query, visualization, performance, security and deployment, and AI. Save this guide. Review it before each interview. When the questions come, answer with the calm confidence of someone who has prepared at the architect level.
Good luck: Now go own the interview.


