
105 Financial Analyst Interview Questions and Answers (2026): The Complete Preparation Guide

Table of Contents
This Financial Analyst interview question bank is part of the FinReads Knowledge Excellence Series practical, recruiter-grade preparation for FP&A, investment banking, corporate finance, and equity research candidates. Follow FinReads for more interview masterclasses on Excel, SQL, Python, Power BI, and Tableau.
The bar for financial analyst interviews keeps rising. What used to be a pure accounting and DCF drill now spans behavioural storytelling, financial modeling, FP&A judgement, Excel fluency, Power BI dashboarding, and SQL/Python proficiency. Hiring teams expect you to articulate the three-statement walkthrough cold, then pivot to writing a SQL join and explaining a CALCULATE function in DAX.
This guide compiles 105 of the most frequently asked financial analyst interview questions across seven critical domains. Every answer is shaped for the interview room concise, technically precise, and immediately repeatable. Whether you’re targeting FP&A, investment banking, corporate finance, or equity research, this is your tactical preparation playbook.
Section 1: Behavioural, Fit, and Career Questions
Interviewers open with these for a reason they reveal who you are before testing what you know.
Motivation and Background
Why do you want to be a financial analyst? Tie your motivation to a concrete moment a class, a project, a model you built so the answer feels earned, not scripted.
Why do you want to work here specifically? Research the company’s recent growth, signature transactions, or market position. End with a one-sentence vision of your first 12 months. That reframes “why us” into “why we should hire you.”
Why are you leaving your current job? Frame the move as running toward something new, not running away. Speaking poorly of a former employer is an instant red flag.
Greatest strengths and weaknesses? Pick strengths recruiters seek analytical skill, attention to detail, work ethic. For weaknesses, pick something real but not a deal-breaker, then describe the habit you’ve built to manage it. Avoid the clichéd “perfectionist.”
Failures, Conflict, and Working Style
Tell me about an analysis gone wrong. Describe the mistake openly, explain the flawed assumption, and detail the fix. Spend most of your airtime on the lesson and the fix, not the error.
Tell me about presenting financial data. Use the STAR method. Quantify the outcome audience size, decision made, dollars influenced so the story lands as impact, not activity.
Alone or in a team? Align with the company’s culture and give a specific team modeling example. Forced neutrality reads as evasive.
Handling disagreement over a recommendation? Advocate for your conclusion with data while maintaining the relationship. End with the resolution.
Competing priorities and tight deadlines? Discuss deadline mapping, hard vs. soft categorization, and proactive communication. Mention one tactical tool you actually use (kanban, calendar-blocking).
Career Maturity and FP&A Judgement
For the remaining behavioural questions, the pattern is consistent: be specific, quantify outcomes, and show maturity:
- Feedback preference: Show you actively ask for feedback rather than wait a high-performer marker
- Certifications: Demonstrate momentum on CFA, CPA, FMVA, or CMA
- Great FP&A analyst: Emphasize business-partnering instincts translating numbers into decisions
- Pushing back on a budget: Defend the numbers with data without burning relationships
- Cost-saving opportunity: Quantify the savings; walk through how you spotted, validated, and implemented
- Reporting vs. insight: “Revenue down 8%” is reporting; “revenue down 8% because the enterprise renewal cycle slipped here’s what we should do” is insight
- CFO hypothetical: Show strategic awareness reference the company’s actual capital structure or competitive position
Section 2: Financial Statements and Accounting
This is the single most-tested domain in finance interviews. Master it cold and the rest becomes easier.
The Three Statements and How They Link
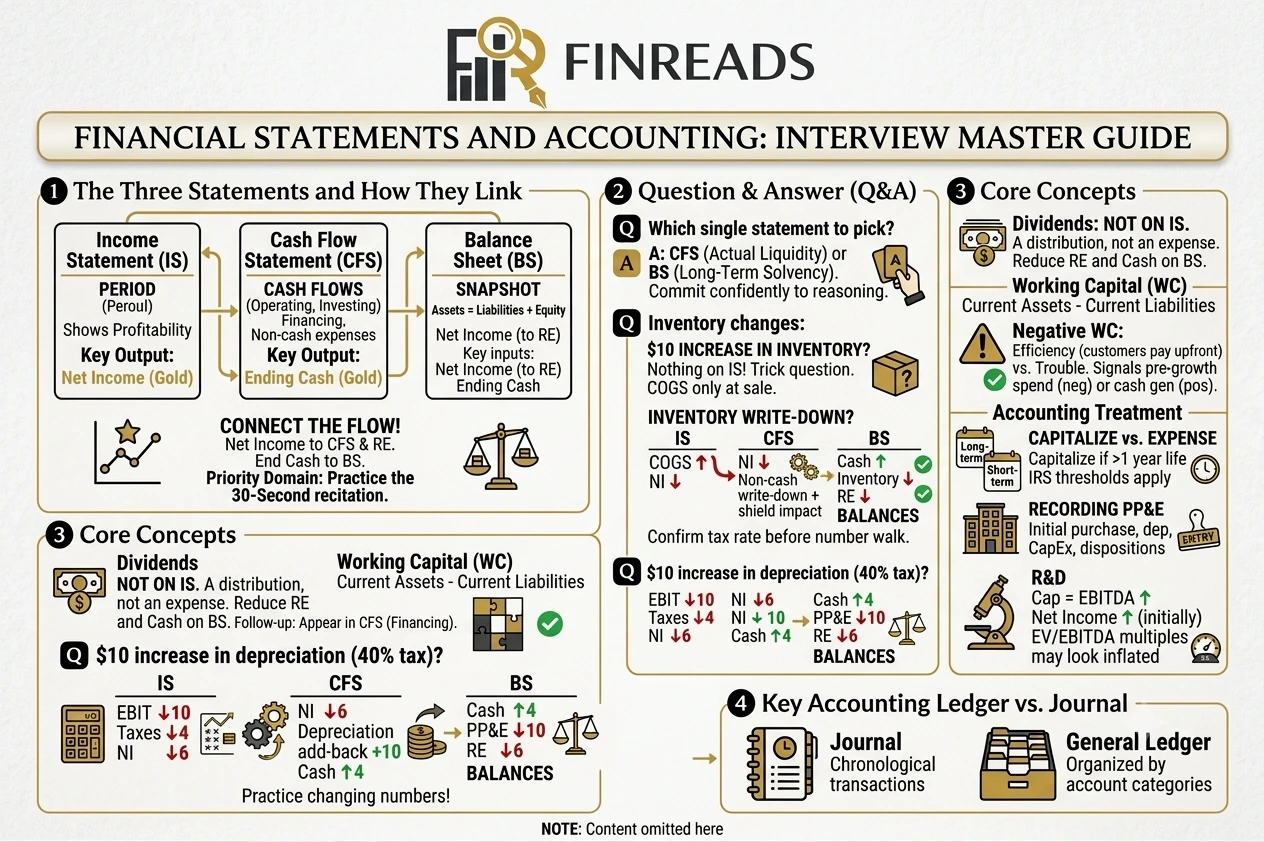
Walk me through the three financial statements. The Income Statement shows profitability over a period. The Balance Sheet is a snapshot of assets, liabilities, and equity. The Cash Flow Statement shows how cash moved from operating, investing, and financing activities.
How are the three statements connected? Net Income flows from the Income Statement into the top of the Cash Flow Statement and into Retained Earnings on the Balance Sheet. Non-cash expenses (like depreciation) are added back on the CFS. Ending cash on the CFS ties directly to Cash on the Balance Sheet. If you can’t recite this flow in 30 seconds, prioritise it above almost everything else.
Which single statement would you pick to evaluate a company? Either the Cash Flow Statement (actual liquidity, no non-cash distortions) or the Balance Sheet (long-term solvency) is defensible. Commit confidently to your reasoning.
Classic Linkage Questions
Inventory write-down impact on all three statements?
- Income Statement: COGS rises, Net Income falls
- Cash Flow Statement: Net Income decreases, but the non-cash write-down is added back; net cash impact equals the tax shield
- Balance Sheet: Cash up (tax shield), Inventory down, Retained Earnings down and it balances
Confirm the assumed tax rate before walking through numbers.
If inventory goes up by $10, what happens on the income statement? Nothing it’s a trick question. The inventory hasn’t been sold, so no COGS is recognized.
$10 increase in depreciation (40% tax)?
- Income Statement: EBIT down $10, taxes down $4, Net Income down $6
- Cash Flow Statement: Net Income down $6, non-cash depreciation added back $10; cash up $4
- Balance Sheet: Cash up $4, PP&E down $10, Retained Earnings down $6
Practice with different numbers interviewers love changing inputs mid-answer.
Working Capital and Other Core Concepts
Why don’t dividends appear on the Income Statement? Dividends are a distribution of profits to equity providers, not an operating expense. They flow through shareholders’ equity and reduce cash on the Balance Sheet. Follow-up: dividends appear in the financing section of the Cash Flow Statement.
Working capital? Current Assets minus Current Liabilities. In banking, it’s defined more narrowly current assets excluding cash, minus current liabilities excluding interest-bearing debt.
Negative working capital? Can signal operational efficiency (Amazon, Walmart, McDonald’s customers pay upfront, suppliers paid on terms). For other industries it can signal financial trouble.
Change in Working Capital intuitively? Tells you whether a company needs to spend ahead of growth (negative) or generates cash from growth (positive). Tie it to free cash flow.
Accounting Treatment Questions
Capitalize vs. expense? Capitalize if used in the business for more than one year. GAAP and IRS apply de minimis thresholds ($2,500–$5,000) in practice.
Recording PP&E? Initial purchase, depreciation, additions (CapEx), and dispositions. Be ready to walk through the journal entry debit PP&E, credit cash.
Capitalizing R&D vs. expensing? EBITDA increases by the capitalized amount. Net Income initially rises. Cash flow is unchanged, but multiples like EV/EBITDA look artificially inflated this is why software and pharma look different from industrials.
Ledger vs. journal? A journal records transactions chronologically. A general ledger organizes them into accounting categories.
Can a company be in trouble with positive cash flow? Yes for example, selling off inventory while delaying payables. The reverse matters too: profitable companies with negative cash flow often precede distress.
Section 3: Corporate Finance, Valuation, and M&A
This section separates the prepared from the unprepared. Master WACC, DCF, EV/EBITDA, and accretion/dilution to handle 80% of the technical drill.
Capital Structure, WACC, and Financial Health
Which is cheaper: debt or equity? Debt is structurally cheaper. Interest is tax-deductible, and debt holders have senior claims, so they require lower returns. But cheaper doesn’t mean better too much debt raises bankruptcy risk and triggers covenants.
When should a company issue debt instead of equity? When cash flows are predictable, the company has taxable income to benefit from the tax shield, and management wants to optimize WACC without dilution. Mature, asset-heavy businesses are the textbook candidates.
What is WACC? The Weighted Average Cost of Capital:
WACC = (Cost of Equity × % Equity) + (Cost of Debt × (1 – Tax Rate) × % Debt) + (Cost of Preferred × % Preferred)
Practice plugging real numbers interviewers often ask for a WACC calculation in under two minutes.
Evaluating financial health using ratios? Combine four categories: Liquidity (Current, Quick), Profitability (Gross/Net Margin), Solvency (Debt-to-Equity), and Efficiency (Asset Turnover). Always compare to industry peers a 1.0x current ratio is healthy for a grocer but alarming for a manufacturer.
What is EBITDA? Earnings Before Interest, Taxes, Depreciation, and Amortization a proxy for core operational cash flow. Charlie Munger famously called it “bullshit earnings” because it ignores CapEx and working capital reinvestment.
Best single metric to analyze a stock? P/E ratio is widely used, but always cite a triangulation approach P/E with EV/EBITDA, DCF, and precedent transactions to signal analytical rigour.
DCF, FCF, and Enterprise Value
Walk me through a DCF. Project Unlevered Free Cash Flows for 5-10 years. Discount to Present Value using WACC. Calculate Terminal Value (exit multiple or Gordon Growth) and discount it. Sum the discounted cash flows and terminal value to find Implied Enterprise Value.
Unlevered Free Cash Flow formula?
UFCF = EBIT × (1 – Tax Rate) + D&A – Change in NWC – CapEx
Memorize both unlevered and levered FCF converting between them requires adding back after-tax interest expense.
EV vs. Equity Value? Equity Value = assets attributable only to common shareholders. Enterprise Value = value of core operations attributable to all investors (debt, equity, preferred). Bridge: EV − Net Debt − Preferred − Minority Interest = Equity Value.
Why is cash deducted from Enterprise Value? Cash is a non-core-business asset an acquirer would use the target’s cash to pay down the purchase price on day one.
EV/EBITDA vs. P/E? EV/EBITDA excludes capital structure and CapEx, ideal for operational comparisons across companies with different leverage. P/E includes interest and taxes, useful for banks and insurance firms.
Valuation, LBOs, and Merger Models
Which methodology produces the highest value? Precedent Transactions typically run highest because they include a control premium. DCF can run highest if growth and margin assumptions are aggressive garbage in, garbage out.
Walk me through an LBO. A PE firm acquires a company using debt-and-equity mix. Set assumptions (purchase price, debt/equity, margins). Build Sources & Uses. Adjust the Balance Sheet for new debt and goodwill. Project cash flows to determine debt paydown. Calculate exit value and IRR. Sponsors target 20%+ IRR and 2.0–3.0x cash-on-cash over a five-year hold.
Walk me through a merger model. Project both companies’ statements. Determine purchase price and payment mix (cash, debt, stock). Combine Balance Sheets, creating new Goodwill. Combine Income Statements with foregone interest, new interest, and synergies. Divide Combined Net Income by the new share count for Combined EPS that determines accretive or dilutive.
25x P/E acquires 15x P/E in all-stock accretive or dilutive? Accretive. Buyer’s cost of acquisition (1/25 = 4%) is lower than seller’s yield (1/15 = 6.7%), so EPS rises. Quick rule: higher acquirer P/E = accretive; lower = dilutive. Cash and debt financing change the calculus.
Calculate diluted shares? Use the Treasury Stock Method assume all in-the-money options exercised and proceeds used to buy back shares at the offer price.
Synergies, Defenses, and Intangibles
Three types of M&A synergies? Cost (eliminating duplicates), Revenue (cross-selling), and Financial (lower cost of capital, tax optimization). Cost synergies are the most credible revenue synergies are routinely promised and rarely fully delivered.
Common hostile takeover defenses? Poison Pills, Staggered Boards, and finding a White Knight.
Post-merger integration success? Monitor operational continuity (customer/employee retention), synergy realization, and cultural integration. The first 100 days are decisive.
Valuing intangible assets? Three methods: relief-from-royalty (brands, licenses), multi-period excess earnings (customer relationships), and cost-to-recreate (internally developed technology). For pharma, use risk-adjusted NPV on the R&D pipeline.
Section 4: FP&A, Budgeting, and Forecasting
This section tests whether you can turn numbers into business decisions the heart of FP&A.
Budgeting vs. Forecasting
Difference between budgeting and forecasting? A budget is a static, annual plan with firm guardrails. A forecast is a dynamic, continuous estimation updated monthly or quarterly. Most modern companies run a rolling forecast alongside the annual budget.
Building a budget from scratch? Start with historical data for trends and seasonality. Run sessions with department heads on headcount and initiatives. Reconcile bottom-up requests against top-down revenue projections, build a contingency line, and variance-check against prior actuals. Closing the bottom-up vs. top-down gap is where most FP&A work actually happens.
Building the Model
Modeling revenues? Three approaches Bottom-Up (drivers like customers × ARPU), Top-Down (market size × penetration %), or Year-over-Year growth. Bottom-up is most credible for established businesses; top-down for new product lines.
Modeling operating expenses? Separate fixed costs (rent) from variable costs (commissions, forecasted as % of revenue). Watch for semi-variable costs like utilities and software licenses.
Modeling working capital? Tie receivables, inventory, and payables to revenues and COGS using days or turns ratios. Sanity-check against absolute dollar changes small days movements on large bases can be material.
What Makes a Budget Work
A good budget? Cross departmental buy-in, realistic but stretching targets, risk-adjusted with margin of error, tied to the strategic plan, with named owners for accountability.
Significant mid-year variance? Verify if it’s a timing issue or a true overage. Document magnitude, meet the department head, diagnose the root cause, and bring actionable recommendations.
Communication, Forecasting, and Variance Frameworks
Communicating budget info to non-financial stakeholders? Lead with impact, not numbers. Instead of “12% over budget,” say “funds will be exhausted by mid-August.” Visuals beat tables for non-finance audiences.
Forecasting methods? Rolling 12-month trend for consistent expenses, seasonal adjustment for seasonal businesses, driver-based forecasting for new projects. Combine methods trend plus a driver-based overlay is more defensible than either alone.
Identifying forecast bias? Review previous forecasts against actuals to find systematic errors (consistent over-optimism). Mitigate by combining top-down and bottom-up methods and conducting peer reviews.
The 10 essential variance-analysis questions form the standard FP&A framework: What are the variances? Are they material? Do we care? What caused them? Will they continue? Will they worsen or improve? What will we do? How long will the remedy take? How often should we report? What is the risk of doing nothing? Memorize these they give you a reusable structure for any variance conversation.
Capital Allocation and Modern Tooling
Sensitivity analysis for a capital investment? Build a baseline DCF. Identify critical variables (revenue growth, raw material costs), set ranges, and test impact on NPV and IRR. Two-variable sensitivity tables (revenue × margin, price × volume) are the workhorse format.
Competing capital projects with limited resources? Calculate NPV, IRR, payback, then perform risk-adjusted return analysis. Use the profitability index (NPV per dollar invested) when budgets are constrained.
AI and automation in budget work? AI handles repetitive tasks — data consolidation, anomaly detection, draft narratives freeing analysts for strategic interpretation. Name specific tools you’ve actually used (Copilot, ChatGPT, custom scripts) rather than abstract AI language.
Internal controls for financial reporting? Center on segregation of duties. Combine preventive and detective controls, exception reporting, and clear audit trails. Reference Enron, Wirecard, and 2008 as common interview touchpoints.
Section 5: Excel Skills
Excel fluency is non-negotiable on day one. Expect both conceptual questions and live keyboard tests.
Model Quality, Lookups, and Power Tools
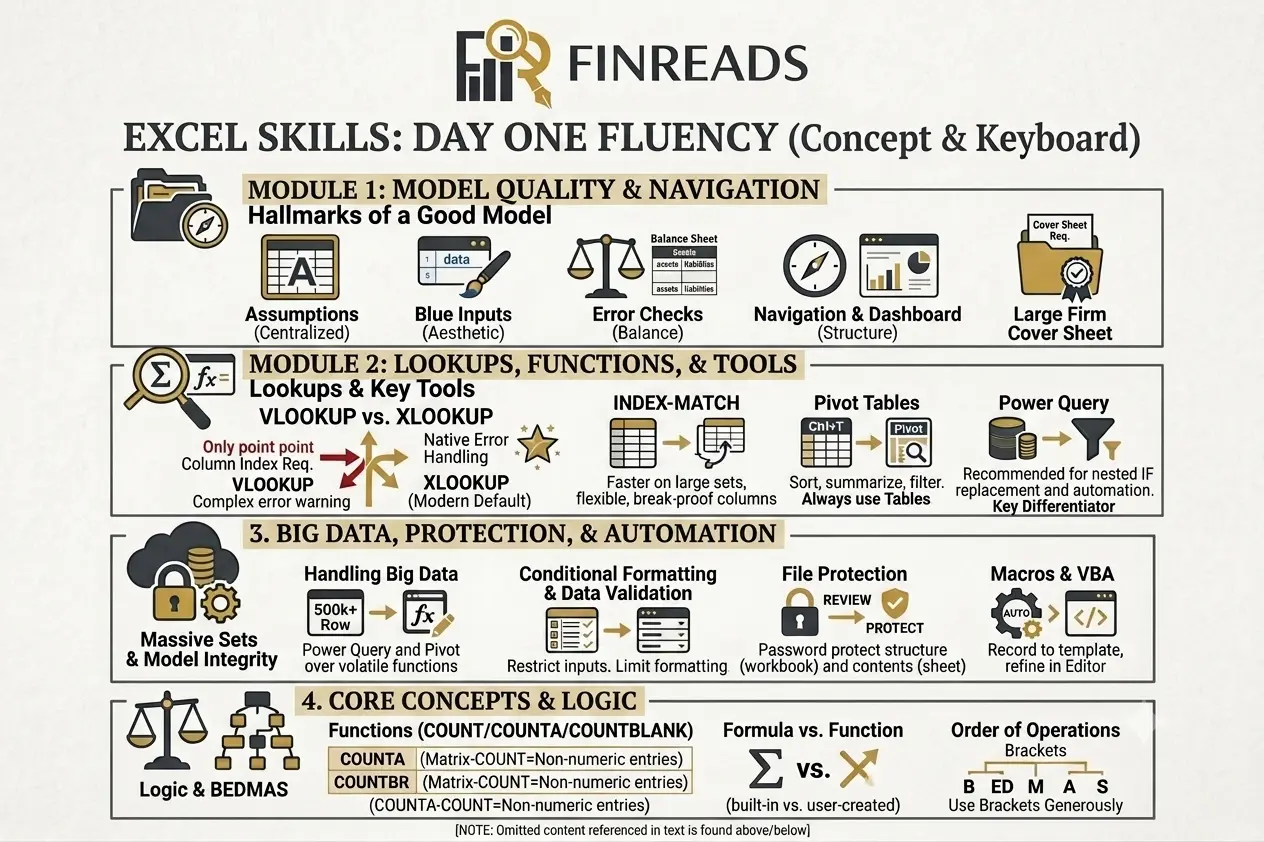
Hallmarks of a good Excel model? Assumptions in one place, distinctly colored (blue font for inputs), error checks (balance sheet balances), logical navigation, and a clean output dashboard. Large firms increasingly require a cover sheet with model purpose, version history, and assumptions list.
VLOOKUP vs. XLOOKUP? VLOOKUP searches left-to-right only, requires a column index, and has complex error handling. XLOOKUP searches in any direction, doesn’t require column numbers, and handles errors natively. XLOOKUP is the modern default but VLOOKUP fluency is still tested in legacy models.
INDEX-MATCH advantages? Faster on large datasets, more flexible, and doesn’t break when columns are inserted or deleted. INDEX returns a value from a position; MATCH finds that position.
Pivot Tables? Sort, summarize, and filter large datasets. Always convert source data into a formal Excel Table (Ctrl+T) first so the pivot refreshes automatically.
Power Query? A data connection and transformation tool for cleaning, deduplicating, merging files, and automating reports. It’s the recommended replacement for nested IF/VLOOKUP cleaning logic fluency here is a clear interview differentiator.
Macros and VBA? Macros automate repetitive tasks by recording steps or running code. VBA is the language. Use the macro recorder for a starting template, then refine in the VBA editor.
Big Data, Functions, and Protection
Handling massive datasets? Avoid volatile formulas, convert raw data into Excel Tables, optimize formulas, and offload cleaning to Power Query and Power Pivot. Once a dataset crosses ~500,000 rows, push into Power Pivot or a proper database.
COUNT vs. COUNTA vs. COUNTBLANK? COUNT counts numbers only; COUNTA counts non-empty cells; COUNTBLANK counts empty cells. COUNTA − COUNT = number of non-numeric entries.
Conditional Formatting? Highlights data by rules. Use sparingly in finance models reserve for variance flags, threshold breaches, and balance-check rows.
Data Validation? Restricts input values (drop-downs, numeric limits) to prevent errors your first line of defense against broken models.
Protect a file? Review → Protect Sheet/Workbook with a password. Workbook-level passwords protect structure; sheet-level passwords protect content.
Order of operations? BEDMAS — Brackets, Exponents, Division, Multiplication, Addition, Subtraction. Use brackets generously for self-documenting logic.
Formula vs. function? A function is built-in (SUM, IF). A formula is user-created and may contain multiple functions.
Section 6: Power BI and Data Visualization
Modern finance teams expect Power BI fluency. Expect questions on DAX, modeling, and performance.
Architecture and DAX
Major components of Power BI? Power Query (ETL), Power Pivot (data modeling with DAX), Power View (visualizations), and the platforms Power BI Desktop and Power BI Service. Power Query feeds Power Pivot, which feeds visuals.
Calculated Column vs. Measure? A Calculated Column is computed during refresh, stored in the model, and has row context. A Measure is computed at query time, has filter context, and doesn’t consume memory. Use measures whenever possible they’re more efficient and respond to slicers.
SUM vs. SUMX in DAX? SUM aggregates a single column. SUMX is an iterator evaluates an expression row-by-row across a table, then sums. Interview trap: summing price × quantity requires SUMX(table, price * quantity), not SUM(price × quantity).
CALCULATE vs. FILTER? CALCULATE modifies filter context to evaluate an expression often called the most important DAX function. FILTER returns a subset table by evaluating row-by-row, often wrapped inside CALCULATE.
Performance, Security, and Modes
Query folding in Power Query? Power Query pushes transformations back to the source (translating to native SQL) instead of processing locally a massive performance win. Right-click a step → View Native Query to verify folding.
Row Level Security (RLS)? Create a security mapping table linking UserEmail to permitted Region. Define a role in Power BI Desktop with a DAX filter using USERPRINCIPALNAME(). Publish and assign users in Power BI Service. Always test with View as Role before publishing.
Import vs. DirectQuery vs. Live Connection?
- Import: Loads data fully into memory fastest performance, default choice
- DirectQuery: Leaves data at source, sends real-time queries freshest data
- Live Connection: Connects to an external Analysis Services model
Diagnosing a slow Power BI report? Use Performance Analyzer to isolate slow DAX or visual rendering. Optimize by removing unused columns, replacing iterators (SUMX) with simple aggregations (SUM), changing bi-directional relationships to single-direction, and pushing ETL to source via query folding. Aim for a star schema.
Power BI Dataflows? The centralized ETL layer in Power BI Service. Dataflows store cleaned data in Azure Data Lake so multiple datasets share the same transformation logic.
Power BI vs. Tableau? Power BI uses DAX with deep Microsoft integration. Tableau uses MDX, handles massive datasets, and offers deeper visual customization but a steeper learning curve. The two are converging organizational fit and pricing usually decide.
Section 7: SQL, Python, and Statistics
The technical layer modern finance teams demand. Even non-data finance roles now expect basic SQL and Python.
SQL Fundamentals
INNER vs. LEFT vs. RIGHT vs. FULL OUTER JOIN?
- INNER JOIN: Only matched rows in both tables
- LEFT JOIN: All left-table rows + matched right (NULLs if no match)
- RIGHT JOIN: All right-table rows + matched left
- FULL OUTER JOIN: All rows from both tables, NULLs where no match
Visualize with overlapping Venn circles much easier to recall under pressure.
WHERE vs. HAVING? WHERE filters rows before grouping. HAVING filters groups after GROUP BY, often on aggregates like SUM or COUNT.
Python and Pandas
Handling missing values in Pandas? Use fillna() to impute (mean, median, mode) or dropna() to remove rows/columns. Under 5% missing can often be dropped; columns missing 50%+ usually need imputation or removal.
loc vs. iloc? loc is label-based indexing. iloc is integer-position-based. df.loc[0] selects by the label ‘0’; df.iloc[0] selects by position zero.
Data analysts vs. data scientists? Analysts collect, clean, and analyze using Excel, SQL, and Power BI. Data scientists build and deploy machine learning models with heavy programming. The distinction is blurring — modern analyst roles increasingly expect basic Python and exposure to scikit-learn.
Statistics and EDA
Descriptive vs. predictive analysis? Descriptive answers “What happened?” using summary stats. Predictive forecasts “What is likely to happen?” using statistical and ML models. A mature analytics function covers all four: descriptive, diagnostic, predictive, and prescriptive.
Exploratory Data Analysis (EDA)? Using graphical and statistical techniques to understand a dataset’s structure, identify outliers, and discover relationships before modeling. Typical workflow: shape and dtypes → missing values → summary statistics → distributions → correlations → targeted hypotheses.
Central Limit Theorem? As sample size increases, the distribution of sample means approaches a normal distribution, regardless of the original population. Rule of thumb: n ≥ 30.
P-value? Probability of observing the data if the null hypothesis were true. Conventional cutoff is 0.05, but treat it as evidence strength rather than a binary verdict.
Type I vs. Type II errors? Type I (False Positive): Rejecting a true null. Type II (False Negative): Failing to reject a false null. Lowering alpha reduces Type I but increases Type II — the right balance depends on the cost of each mistake.
Data Wrangling? Cleaning, transforming, and organizing raw data into usable form. Industry estimates put it at 60–80% of an analyst’s time.
Structured vs. unstructured data? Structured sits in rigid rows and columns (relational databases). Unstructured lacks predefined format (text, images, video). Semi-structured (JSON, XML, logs) sits between — modern analysts handle all three.
How to Prepare for Your Financial Analyst Interview

You now have the technical map. Here’s how to convert it into interview performance:
- Drill the three statements cold. If you can’t walk the linkages in 30 seconds, prioritize this above everything else — it’s the most-tested concept in finance interviews
- Run numerical walkthroughs out loud. Depreciation, inventory write-down, and accretion/dilution mechanics are fluency tests, not memorization tests
- Build a project story bank. Prepare 3–4 STAR stories covering variance-driven decisions, models built, cross-functional disagreements, and cost-saving wins — and quantify outcomes
- Don’t neglect the modern stack. Expect questions on Power BI, SQL, and Python even in pure finance roles — fix any gaps before the interview
- Match depth to role. A junior FP&A analyst won’t get drilled on LBOs; an IB summer analyst will — tailor preparation to the specific role and firm
- Practice the 30-second answer. The gap between knowing the answer and saying it cleanly under pressure is huge — rehearse out loud
Final Thoughts
The financial analyst interview has evolved into a multi-layered assessment behavioural depth, accounting mechanics, valuation fluency, FP&A judgement, and the modern analyst toolkit. The candidates who get offers aren’t always the ones who know more they’re the ones who can articulate what they know clearly under pressure.
Save this guide. Review it the night before each interview. When the questions come, answer with the calm confidence of someone who has prepared exactly for this moment.
Good luck: Now go own the interview.


